Overview
The GRI has been benchmarked against five major survey programs with different design philosophies, geographic scopes, and sample sizes:
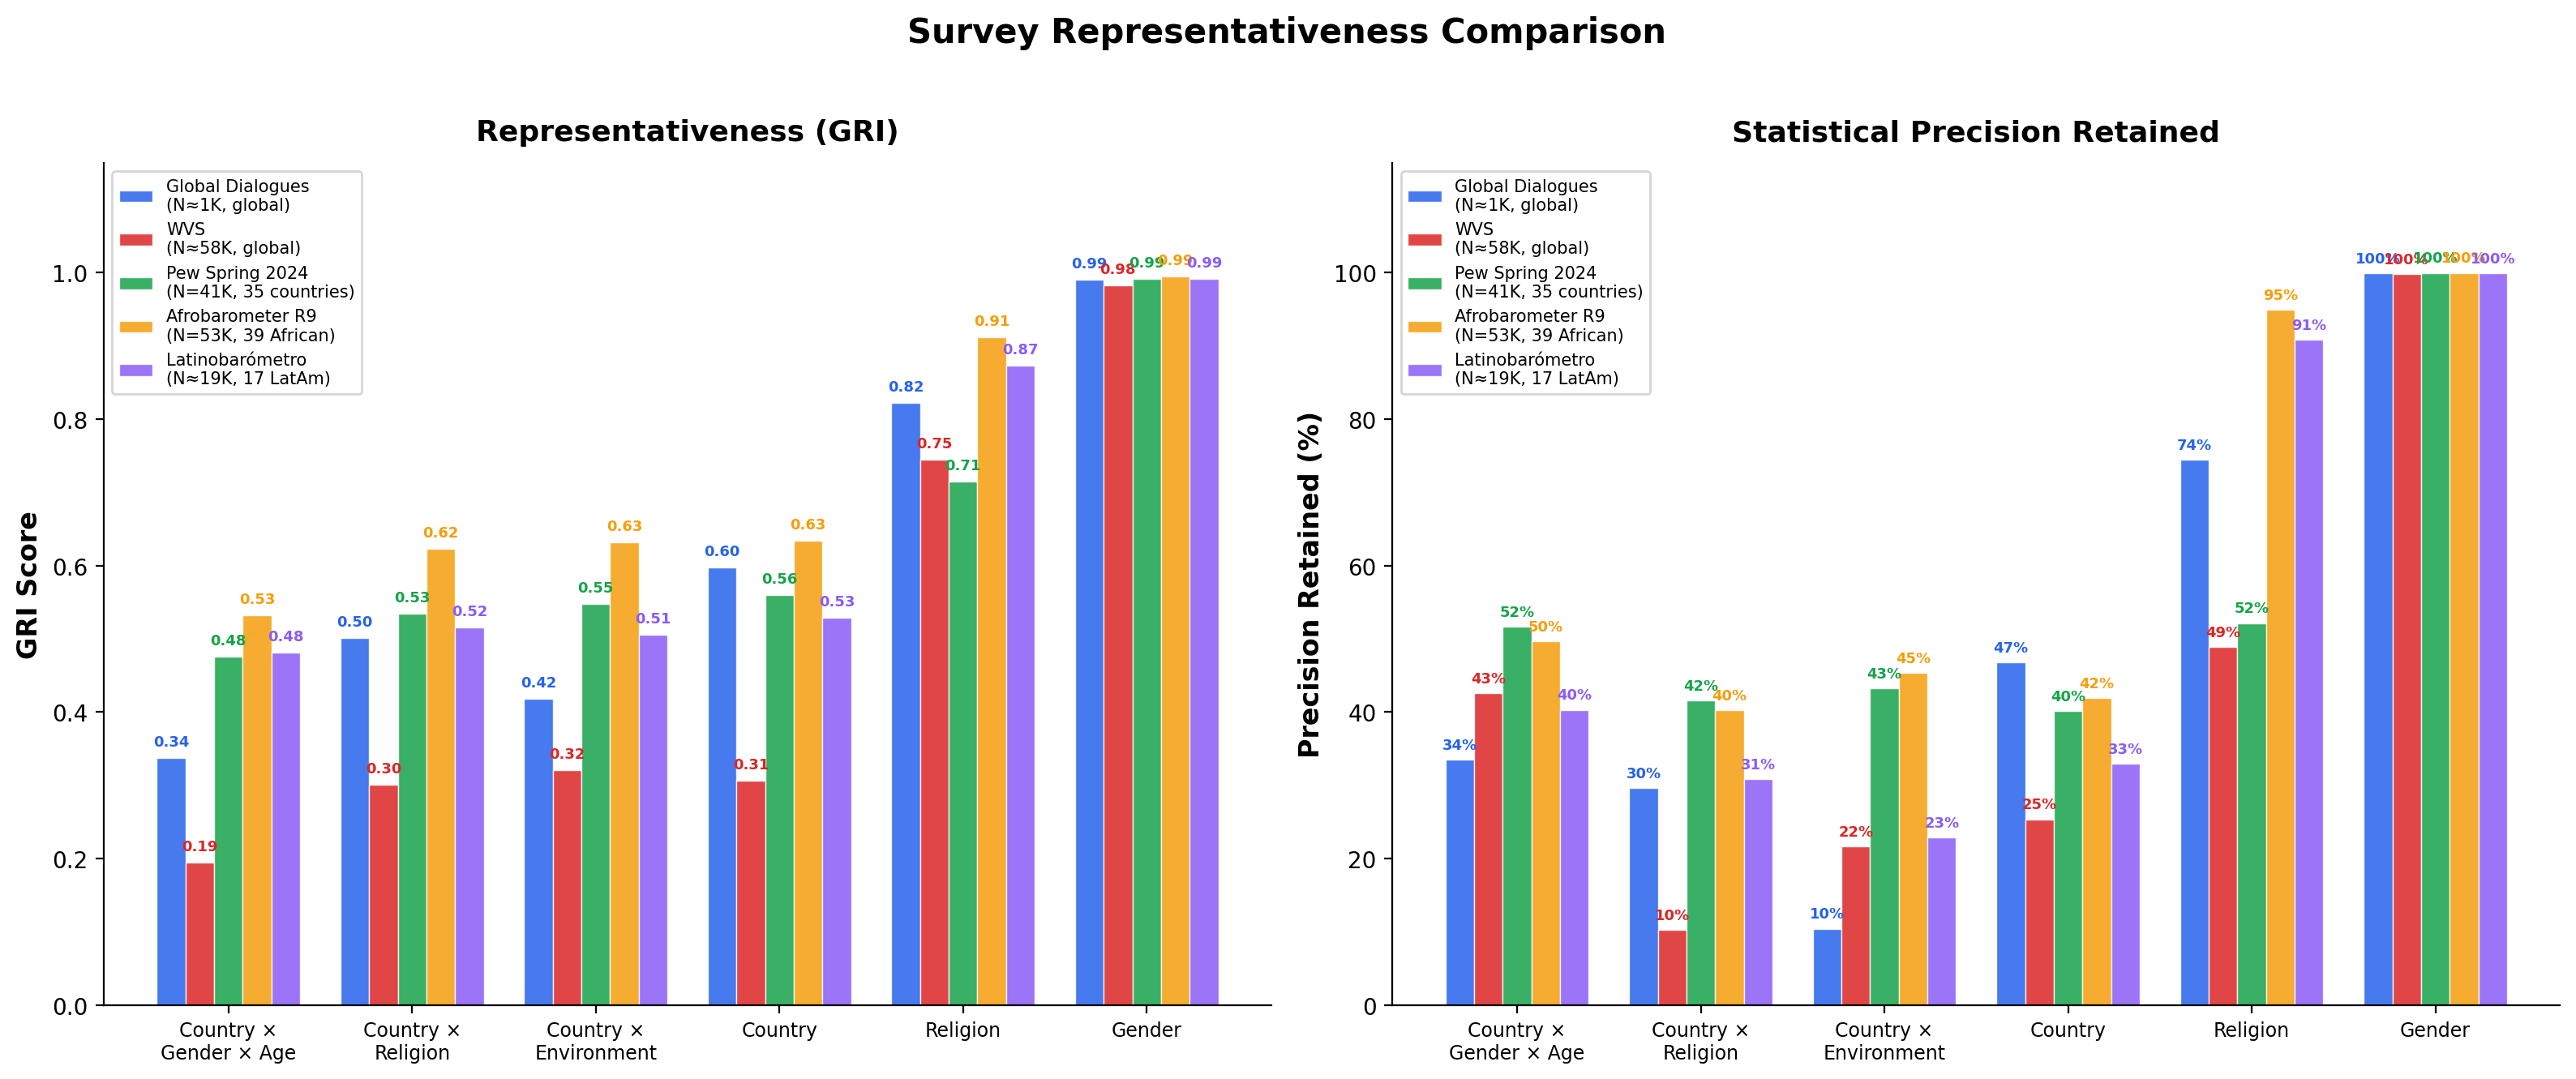
- Global Dialogues — A longitudinal survey series capturing public perceptions of AI, deliberately designed for global demographic representation (~1,000 participants per wave from 50+ countries).
- World Values Survey — The largest global social survey program, running since 1981, with ~58,000 participants per wave across 60–100 countries.
- Pew Global Attitudes — Pew Research Center’s annual international survey, with ~1,000 respondents per country across 35 countries in Spring 2024.
- Afrobarometer — A pan-African survey network covering 39 countries, with ~53,000 respondents in Round 9 (2021–2023).
- Latinobarómetro — A Latin American public opinion survey covering 17 countries, with ~19,000 respondents per wave.
Global Dialogues and WVS claim to represent the global population, so their GRI is calculated against global demographic benchmarks. Regional surveys—Afrobarometer, Latinobarómetro, and Pew—are scored against the populations of the countries they actually survey. A GRI of 0.80 means “80% representative of the population you claim to cover,” making scores comparable across programs regardless of geographic scope.
Cross-Survey Comparison
GRI Scores (Key Dimensions)
GD and WVS are averages across waves. Latinobarómetro is averaged across 2023–2024.
| Country x Gender x Age |
0.34 |
0.20 |
0.48 |
0.53 |
0.48 |
| Country x Religion |
0.50 |
0.30 |
0.53 |
0.62 |
0.52 |
| Country x Environment |
0.42 |
0.32 |
0.55 |
0.63 |
0.51 |
| Country |
0.60 |
0.31 |
0.56 |
0.63 |
0.53 |
| Religion |
0.82 |
0.75 |
0.72 |
0.91 |
0.87 |
| Environment |
0.63 |
0.85 |
0.78 |
0.94 |
0.92 |
| Age Group |
0.71 |
0.83 |
0.93 |
0.91 |
0.97 |
| Gender |
0.99 |
0.98 |
0.99 |
0.99 |
0.99 |
| Overall (13 dim. avg) |
0.64 |
0.55 |
0.69 |
0.81 |
0.78 |
Precision Retained (Key Dimensions)
Fraction of nominal sample size that contributes to inferential precision after reweighting.
| Country x Gender x Age |
34% |
43% |
52% |
50% |
40% |
| Country x Religion |
30% |
10% |
42% |
40% |
31% |
| Country x Environment |
10% |
22% |
43% |
45% |
23% |
| Country |
47% |
25% |
40% |
42% |
33% |
| Religion |
74% |
49% |
52% |
95% |
91% |
| Gender |
100% |
100% |
100% |
100% |
100% |
Key Takeaways
- Deliberate design outperforms convenience sampling. GD achieves 40–70% higher GRI on intersectional dimensions with ~1,000 participants vs. WVS’s ~58,000.
- Regional surveys excel within their scope. Afrobarometer and Latinobarómetro achieve GRI > 0.78 against their claimed populations, demonstrating strong representativeness of the regions they target.
- Equal-per-country designs sacrifice country-level representativeness. Pew and WVS both allocate ~1,000 respondents per country regardless of population, creating large design effects at the country level.
- Intersectional precision is universally expensive. No survey retains more than 52% of its nominal precision on Country x Gender x Age—the combinatorial challenge of matching multiple distributions simultaneously is inherent.
- Afrobarometer achieves the highest overall GRI (0.81) partly because its 39-country scope represents a more homogeneous religious landscape than the global population, making religion matching easier.
Global Dialogues (GD1–GD8)
| GD1 |
1,280 |
Wave 1 |
| GD2 |
1,105 |
Wave 2 |
| GD3 |
971 |
Wave 3 |
| GD4 |
1,050 |
Wave 4 |
| GD5 |
1,057 |
Wave 5 |
| GD6 |
1,037 |
Wave 6 |
| GD8 |
904 |
Wave 8 |
Primary Dimensions
| Country x Gender x Age |
0.337 |
0.329 |
0.348 |
0.361 |
0.347 |
0.341 |
0.296 |
| Country x Religion |
0.482 |
0.488 |
0.514 |
0.535 |
0.499 |
0.495 |
0.496 |
| Country x Environment |
0.424 |
0.394 |
0.435 |
0.453 |
0.414 |
0.406 |
0.402 |
Regional Dimensions
| Region x Gender x Age |
0.544 |
0.543 |
0.570 |
0.577 |
0.563 |
0.559 |
0.529 |
| Region x Religion |
0.597 |
0.587 |
0.632 |
0.647 |
0.609 |
0.621 |
0.625 |
| Region x Environment |
0.538 |
0.507 |
0.562 |
0.576 |
0.520 |
0.518 |
0.522 |
| Region |
0.745 |
0.739 |
0.791 |
0.799 |
0.738 |
0.734 |
0.769 |
Single-Axis Dimensions
| Country |
0.590 |
0.573 |
0.618 |
0.639 |
0.592 |
0.587 |
0.581 |
| Continent |
0.832 |
0.830 |
0.886 |
0.883 |
0.773 |
0.802 |
0.856 |
| Religion |
0.817 |
0.819 |
0.833 |
0.826 |
0.813 |
0.806 |
0.840 |
| Environment |
0.629 |
0.623 |
0.642 |
0.628 |
0.635 |
0.620 |
0.636 |
| Age Group |
0.656 |
0.684 |
0.706 |
0.723 |
0.746 |
0.756 |
0.699 |
| Gender |
0.989 |
0.990 |
0.996 |
0.979 |
0.986 |
0.995 |
0.998 |
Design Effect and Precision Cost (GD Averages)
Averages across GD1–GD8 (N ≈ 1,000 per wave).
| Country x Gender x Age |
0.34 |
3.0 |
189 |
34% |
| Country x Religion |
0.50 |
4.1 |
241 |
29% |
| Country x Environment |
0.42 |
10.9 |
102 |
10% |
| Continent |
0.83 |
1.1 |
965 |
89% |
| Religion |
0.82 |
75 |
– |
– |
| Gender |
0.99 |
1.0 |
1,083 |
100% |
World Values Survey (W1–W7)
| W1 |
9,144 |
1981–1984 |
| W2 |
24,553 |
1990–1994 |
| W3 |
77,761 |
1995–1998 |
| W4 |
60,012 |
1999–2004 |
| W5 |
83,879 |
2005–2009 |
| W6 |
85,219 |
2010–2014 |
| W7 |
62,927 |
2017–2022 |
Design Effect and Precision Cost (WVS Averages)
Averages across W1–W7 (N ≈ 58,000 per wave).
| Country x Gender x Age |
0.20 |
2.7 |
5,695 |
43% |
| Country x Religion |
0.30 |
29.4 |
3,634 |
10% |
| Country x Environment |
0.32 |
45.4 |
5,832 |
22% |
| Continent |
0.67 |
1.6 |
40,371 |
66% |
| Religion |
0.75 |
– |
– |
– |
| Gender |
0.98 |
1.0 |
57,550 |
100% |
Pew Global Attitudes (Spring 2024)
Pew Spring 2024 covers 35 countries across all continents. GRI is calculated against the combined population of these 35 countries, not the full global population. Urbanicity data is only available for face-to-face interview countries (20 of 35).
| Participants |
41,483 |
| Countries |
35 (phone, face-to-face, and online modes) |
| Period |
January–May 2024 |
| Benchmark |
35-country combined population |
GRI Scores by Dimension
Benchmarked against 35-country population.
| Country x Gender x Age |
0.476 |
0.996 |
1.9 |
52% |
| Country x Religion |
0.534 |
0.806 |
2.4 |
42% |
| Country x Environment |
0.547 |
0.524 |
2.3 |
43% |
| Country |
0.560 |
1.000 |
2.5 |
40% |
| Region x Gender x Age |
0.686 |
0.994 |
2.4 |
41% |
| Region x Religion |
0.611 |
0.714 |
2.0 |
49% |
| Region x Environment |
0.693 |
0.625 |
1.3 |
76% |
| Region |
0.683 |
1.000 |
2.0 |
50% |
| Continent |
0.745 |
1.000 |
1.3 |
77% |
| Religion |
0.715 |
0.857 |
1.9 |
52% |
| Environment |
0.776 |
1.000 |
1.0 |
100% |
| Age Group |
0.931 |
1.000 |
1.0 |
97% |
| Gender |
0.992 |
1.000 |
1.0 |
100% |
| Overall |
0.688 |
0.886 |
|
|
Notes:
- Country x Environment diversity is low (0.524) because urbanicity is only recorded for face-to-face interview countries. 15 phone/online countries have no urban/rural data, creating 29% uncovered population in that dimension.
- Equal-per-country sampling (~1,000 per country) means India (1.4B) and Singapore (5.8M) receive equal representation, producing a Country design effect of 2.5.
- Religion coverage: 94% of respondents have valid religion data. 6 of 7 major GRI categories are represented (no Folk Religions category).
Afrobarometer Round 9
Afrobarometer claims to represent the population of 39 African countries. GRI is calculated against that 39-country population, not the global population. Scoring against global benchmarks would yield an Overall GRI of only ~0.35 (since Africa is ~17% of the world population), which would be misleading.
| Participants |
53,444 |
| Countries |
39 African countries |
| Period |
2021–2023 |
| Benchmark |
39-country combined population |
GRI Scores by Dimension
Benchmarked against 39-country African population.
| Country x Gender x Age |
0.532 |
0.995 |
2.0 |
50% |
| Country x Religion |
0.623 |
0.974 |
2.5 |
40% |
| Country x Environment |
0.632 |
0.985 |
2.2 |
45% |
| Country |
0.634 |
1.000 |
2.4 |
42% |
| Region x Gender x Age |
0.800 |
1.000 |
1.4 |
71% |
| Region x Religion |
0.835 |
0.771 |
1.5 |
65% |
| Region x Environment |
0.817 |
1.000 |
1.3 |
77% |
| Region |
0.850 |
1.000 |
1.3 |
76% |
| Continent |
1.000 |
1.000 |
1.0 |
100% |
| Religion |
0.912 |
0.857 |
1.1 |
95% |
| Environment |
0.942 |
1.000 |
1.0 |
99% |
| Age Group |
0.912 |
1.000 |
1.0 |
96% |
| Gender |
0.995 |
1.000 |
1.0 |
100% |
| Overall |
0.807 |
0.968 |
|
|
Notes:
- Continent GRI = 1.000 because all surveyed countries are in Africa—the survey perfectly represents its claimed continental scope.
- Religion GRI = 0.912 reflects good representation of Africa’s predominantly Christian and Muslim population distribution.
- Country-level design effect = 2.4 indicates roughly equal allocation per country despite large population differences (Nigeria 220M vs. Cabo Verde 0.6M).
Latinobarómetro (2023–2024)
Latinobarómetro claims to represent 17 Latin American countries. GRI is calculated against that 17-country population. Urban/rural is derived from city size (< 10,000 = Rural).
| Participants |
~19,200 per wave |
| Countries |
17 Latin American countries |
| Period |
2023 and 2024 |
| Benchmark |
17-country combined population |
GRI Scores by Dimension (Averaged Across 2023–2024)
Benchmarked against 17-country Latin American population. Averaged across 2023 and 2024 waves.
| Country x Gender x Age |
0.481 |
0.993 |
2.5 |
40% |
| Country x Religion |
0.516 |
0.969 |
3.2 |
31% |
| Country x Environment |
0.506 |
0.971 |
4.5 |
23% |
| Country |
0.529 |
1.000 |
3.0 |
33% |
| Region x Gender x Age |
0.932 |
1.000 |
1.0 |
96% |
| Region x Religion |
0.861 |
0.525 |
1.2 |
83% |
| Region x Environment |
0.894 |
1.000 |
1.7 |
60% |
| Region |
0.942 |
1.000 |
1.0 |
98% |
| Continent |
0.787 |
1.000 |
1.2 |
84% |
| Religion |
0.873 |
0.571 |
1.1 |
91% |
| Environment |
0.920 |
1.000 |
1.0 |
93% |
| Age Group |
0.965 |
1.000 |
1.0 |
99% |
| Gender |
0.992 |
1.000 |
1.0 |
100% |
| Overall |
0.784 |
0.925 |
|
|
Notes:
- Region GRI = 0.942 shows excellent representation at the sub-continental level—Latin American countries cluster tightly within one UN region.
- Religion diversity = 0.571 is low because Latin America is predominantly Christian (~90%)—only 4 of 7 major religious categories are represented, which is an accurate reflection of the region.
- Country x Environment design effect = 4.5 suggests uneven urban/rural sampling across countries, likely due to city-size-based classification.
Sampling Efficiency
Raw GRI scores can be misleading without context. A score of 0.35 on Country x Gender x Age sounds low, but the maximum achievable score at N = 1,000 is only 0.79. Efficiency ratios normalize scores against these theoretical ceilings:
| Country x Gender x Age |
0.792 |
0.344 |
43% |
| Country x Religion |
0.938 |
0.502 |
54% |
| Country x Environment |
0.950 |
0.421 |
44% |
GD achieves 43–54% of the theoretical maximum across primary dimensions, indicating room for improvement through targeted recruitment while capturing a meaningful share of achievable representativeness.
Compare Your Survey
The GRI framework can be applied to any survey with demographic data. See the Python library documentation to calculate GRI scores, design effects, and effective sample sizes for your own data.